NDepend: Rules and Metrics

In the last post about what I learned in NDepend, I'll talk about a pragmatic approach to deciding where to refactor code. The combined views of Queries and Rules Explorer, the Queries and Rules Editor and the Metrics view. On their own, they are not that helpful, but combined they contained a trove of data.
Just a small disclaimer if you didn't read the previous article: NDepend is sponsoring my blog with a one year subscription. My views are still my own, if I didn't like their product, I wouldn't be so positive about it.
NDepend contains a trove of queries and rules that analyse the code and spit out all of the numbers from the past views. Should I need something that isn't in NDepend yet, then I can always write my own query to analyse my code. The language is based on LINQ, that's why it's called CQLINQ. I haven't found a need to write my own query yet, but the full power of CQLINQ is at my fingertips.
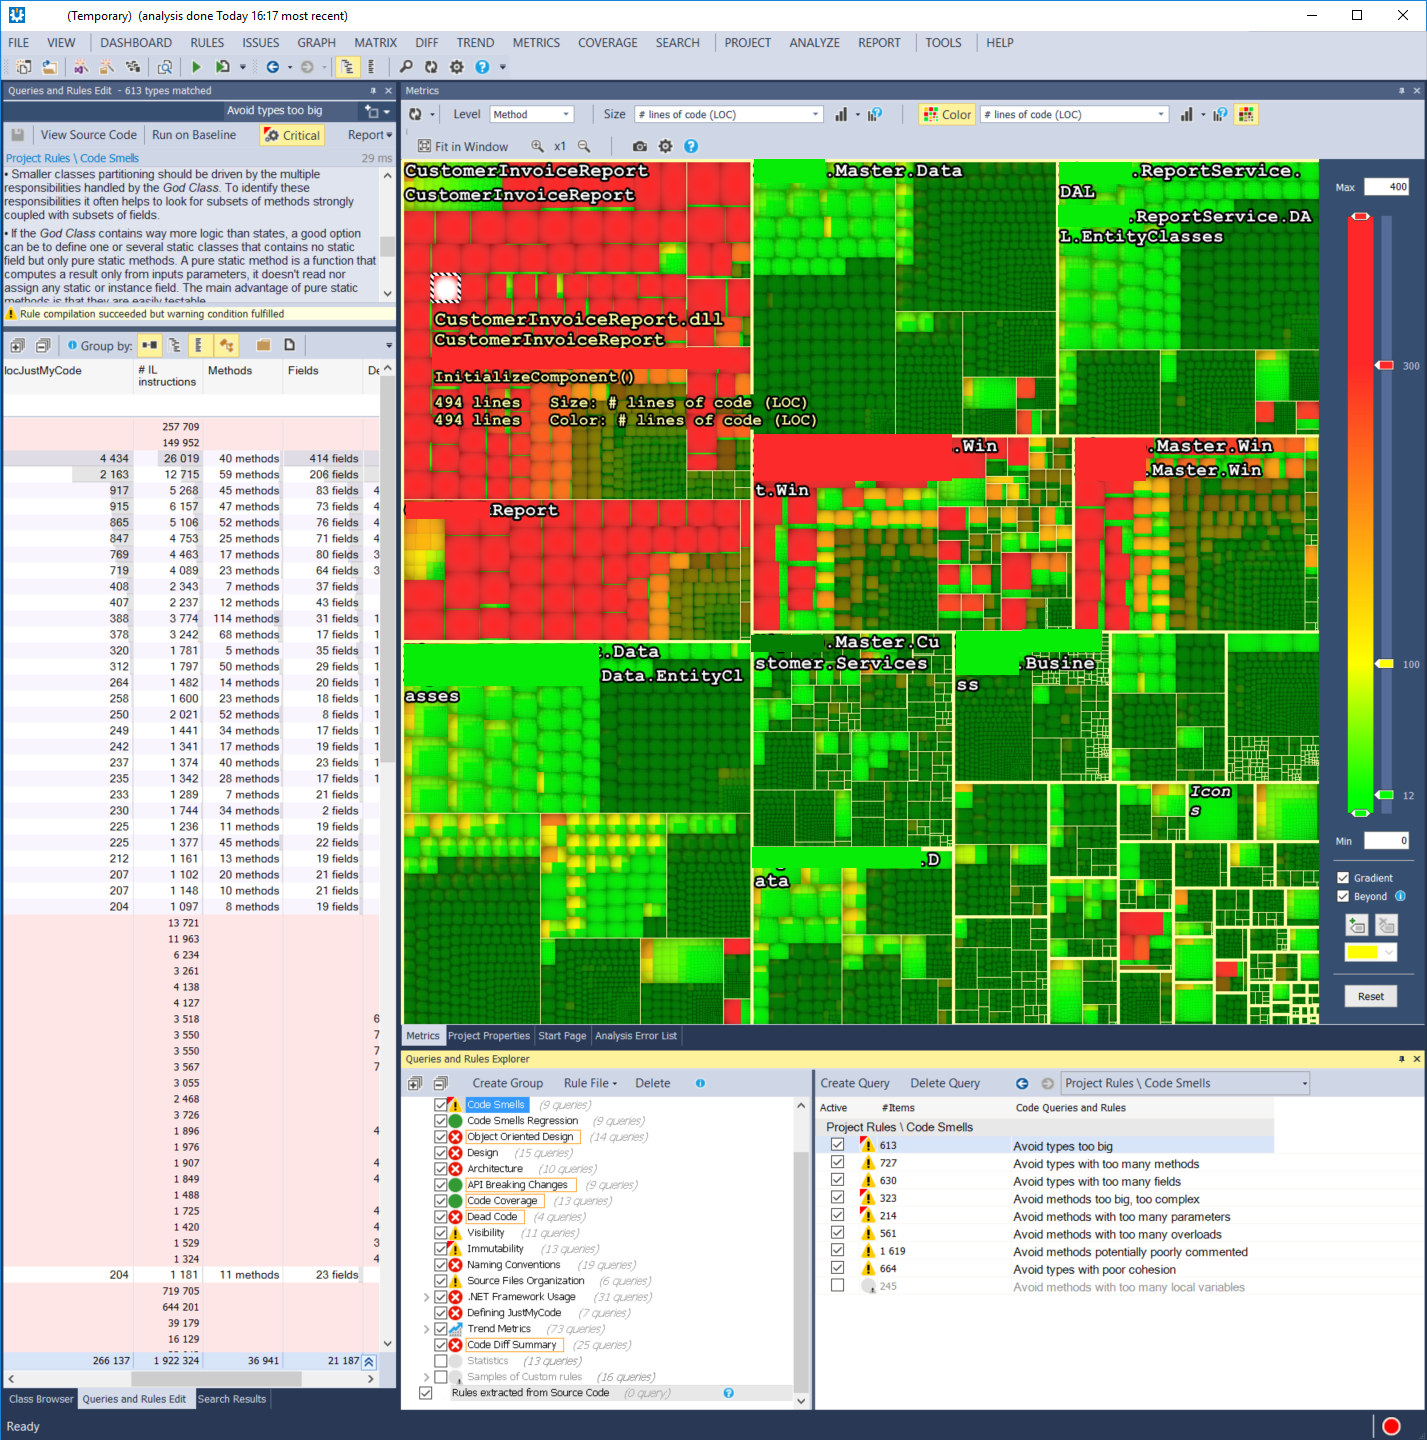
In the Query and Rules Explorer box at the bottom are all rules that are being analysed, neatly ordered by category (Code Smells, Object Oriented Design...). When I select a category, I get a detail of all the rules that are analysed, how severe NDepend thinks they are and how many infractions it found. The first example I want to highlight is the code smell Avoid Types Too Big, it has a whopping 613 hits.
Let's not forget that I did not write all this code and this is a legacy project with some parts of the code base over 10 years old. You know, before anybody thinks I write a lot of way too big classes.
When I click on the Avoid Types Too Big rule, the pane to the left updates itself with the details of this rule. It displays a description of what this rule finds and some helpful information on how to fix these errors. Below the descriptions are the actual details. Before the number of lines of code, there is information about namespaces and types in which the problems are, so they are easily retrievable so I could start refactoring these. There's even a button at the top that will open Visual Studio and load the appropriate file.
Next it shows how many lines there are if it is code that I can access, otherwise it will just show the number of IL instructions. This is for .net framework and NuGet assemblies. The largest file has almost 4.5k lines of code. This could seriously use a refactoring. Unfortunately it's not that easy to do. This code base lacks a good test suite, so any change I make can cause a bug without me knowing it. Yet information like this is vital when I want to construct a plan to improve the whole codebase.
The colourful center displays a heatmap of the places where there are a lot of lines of code. This automatically updates when I select a new rule, but sometimes I need to fiddle a little bit with it to get more useful information out of it.
At the top there are three dropdowns that can influence what is displayed. The first is the level, it can be set to Method, Types, Namespaces and few other options to indicate how in depth I want to go. That means that at the moment each box I hover over (it will display detailed information), is a method. The highlighted white box that is selected is from the CustomerInvoiceReport assembly and I have selected a class (sorry I had to blur that out for privacy reasons) that has an InitializeComponent method.
The size of the boxes is in this case determined by the lines of code. This is the second dropdown. If I select another metric, then the size of the boxes can change. I can indicate that the number of references is more important so that methods (selected at the level) that are referenced more, need to be refactored or optimised first.
The last dropdown determines the scale that will be used to determine the colour. In this case I chose the Lines of Code as well. So bigger boxes should colour more deeply red. The scale can be adjusted to the right of the metrics so that it's more relevant to the scale of my application. For example, the default red colour for lines of code was set to 50. So if a method contains more than 50 lines, it would colour red. With a lot of methods over 150 lines of code, nearly the whole board was red. By adjusting the scale to 300 lines, the really problematic methods became visible.
Lets move on to an Architectural rule: UI Layer Shouldn't Use Directly DB Types. Going to the database directly from the UI is never a good thing. There's no telling what will be updated, there's no validation or business logic called. Yet my predecessors used it quite a bit it seems.
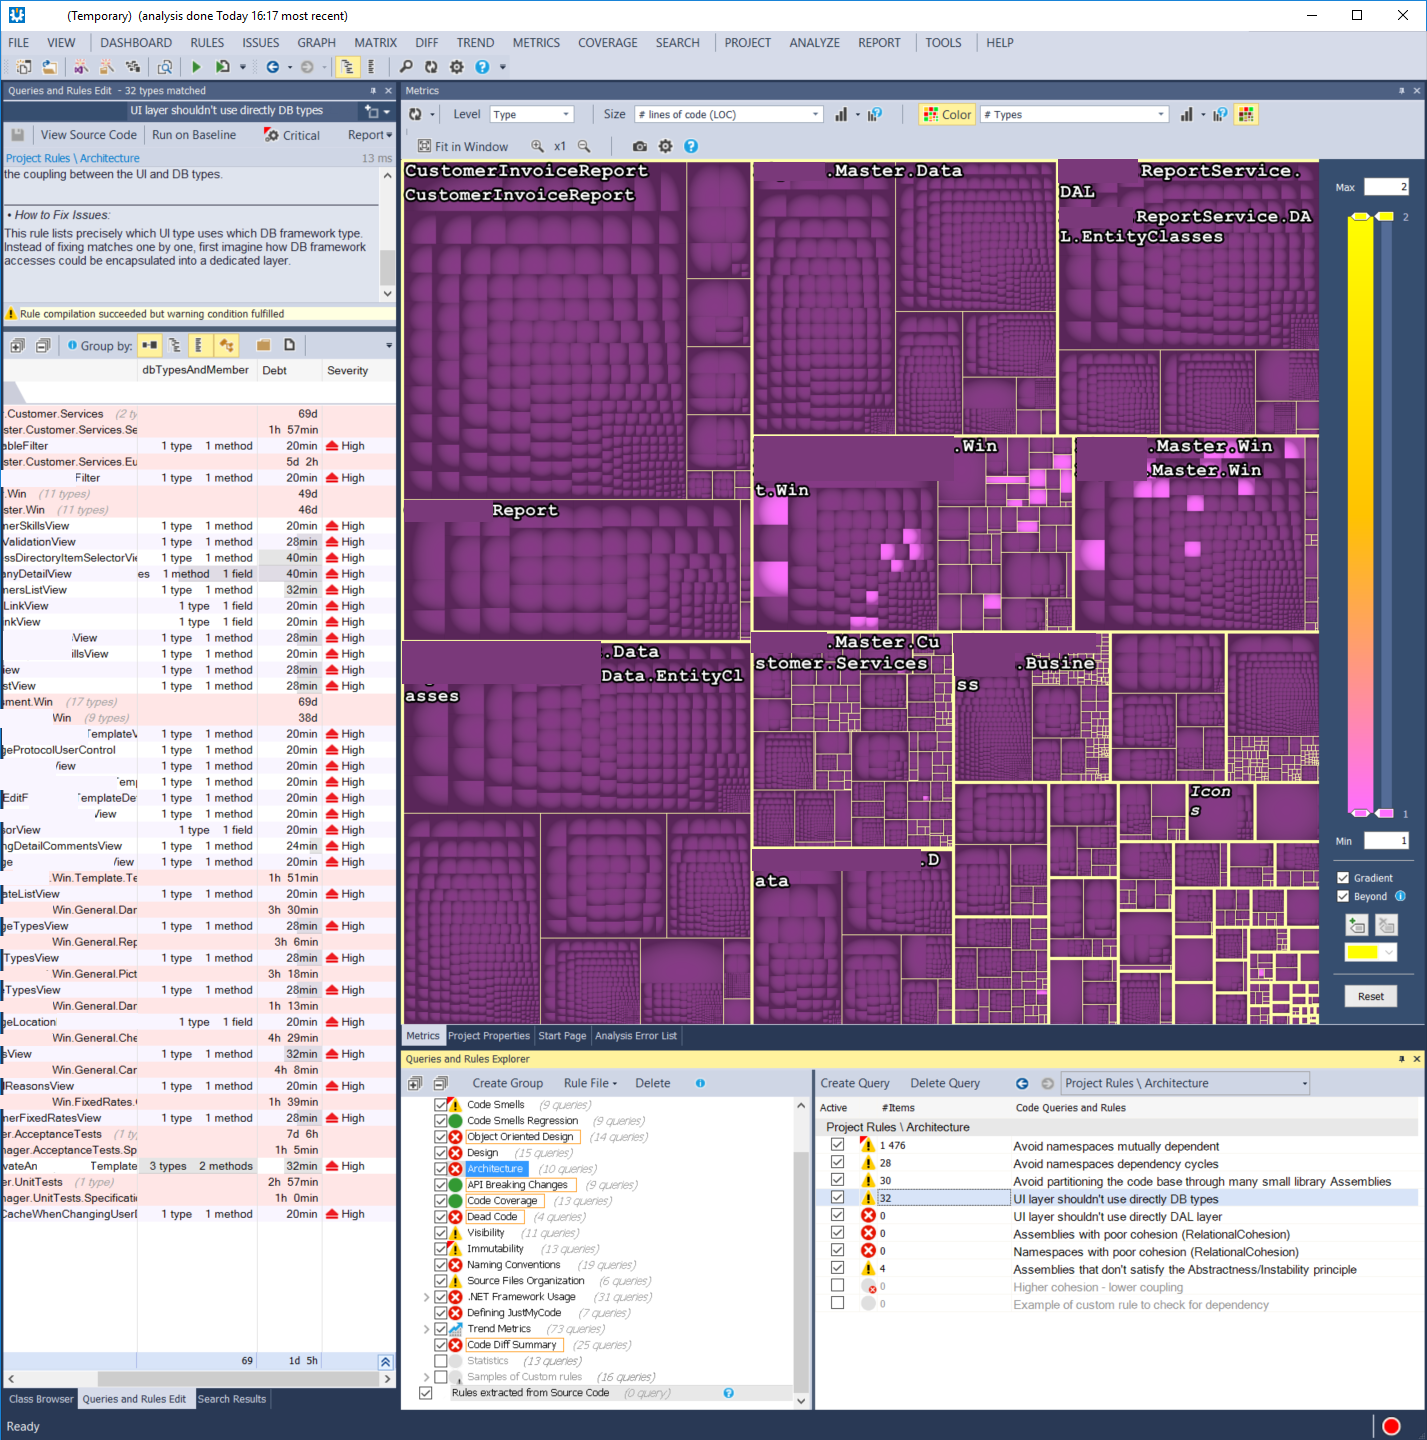
Now the first thing that I want to address here is that I didn't update the scale to include 0, which makes it look like very part of my application is accessing the database because everything below 1 will be coloured purple too. So let this be a warning to double check that the scale is correct. Fortunately, this only affects the Metrics view.
That is the only real downside I can find in this trio of views: the default displays for the Metrics could sometimes need some tweaking. Then again, the sheer customisability makes this an incredible hard task to tackle. Lets not forget that a report for one person isn't always useful for everybody else. So get experimenting with those three dropdowns and the scale to see what combination of metrics makes it easy to spot errors for you.
The upside is that the Queries and Rules Editor isn't affected by this and displays correct information about what UI views consume database types. So the information is still very easily consumable and available.
These are just two examples of what I can learn about these screens and just the tip of the iceberg of what I can learn with NDepend about my code base. And that's from a guy who has only used this tool sporadically in the past few weeks. It's very intuitive, offers lots of insights and has much more hidden away. I can truly recommend NDepend if you need to analyse a piece of code. I'll be using my free copy (and after that my own licence) as much as I can.