


To get information about an object, I mostly overload the ToString method to display information in the local debug or the popup window. Then I found out that there is another way.
There is an attribute called <a href="https://docs.microsoft.com/en-us/dotnet/framework/debug-trace-profile/enhancing-debugging-with-the-debugger-display-attributes" target="_blank" rel="noopener">DebuggerDisplayAttribute</a> that can be put on a class. The constructor accepts a string where property names can be put between brackets as a way of constructing the text to display. When I read it like that, it sounds complicated, so let me give an example.
internal class Person
{
  public int Id { get; set; }
  public string Name { get; set; }
  public DateTime Birthday { get; set; }
}
internal class PersonToString : Person
{
  public override string ToString()
  {
    return $"ToString {Name} ({Id}): {Birthday}";
  }
}
[DebuggerDisplay("Attribute {Id} - {Name} ({Birthday})")]
internal class PersonDebuggerAttribute : Person { }
From a debugging point of view, the Person class will just display the full type name. The PersonToString and PersonDebuggerAttribute classes will display actual values.
What would happen when this Person class and their child classes are used in a composite class? Luckily I prepared a little example for this scenario as well:
internal class Order
{
  public Order()
  {
    ProductId = Guid.NewGuid();
  }
  public int Id { get; set; }
  public Guid ProductId { get; set; }
  public Person Person { get; set; }
}
internal class OrderToString : Order
{
  public override string ToString()
  {
    return $"ToSTring {Id}: {Person}";
  }
}
[DebuggerDisplay("Attribute ({Id}){Person}")]
internal class OrderDebuggerAttribute : Order { }
This will use the Person property in the display of the Order class. Let's find out how this shows up in both Visual Studio 2017 and the JetBrains Rider IDE. The two IDEs handle the information in nearly the same way, except for the DebuggerDisplayAttribute in a composite scenario. Let's see how this works.
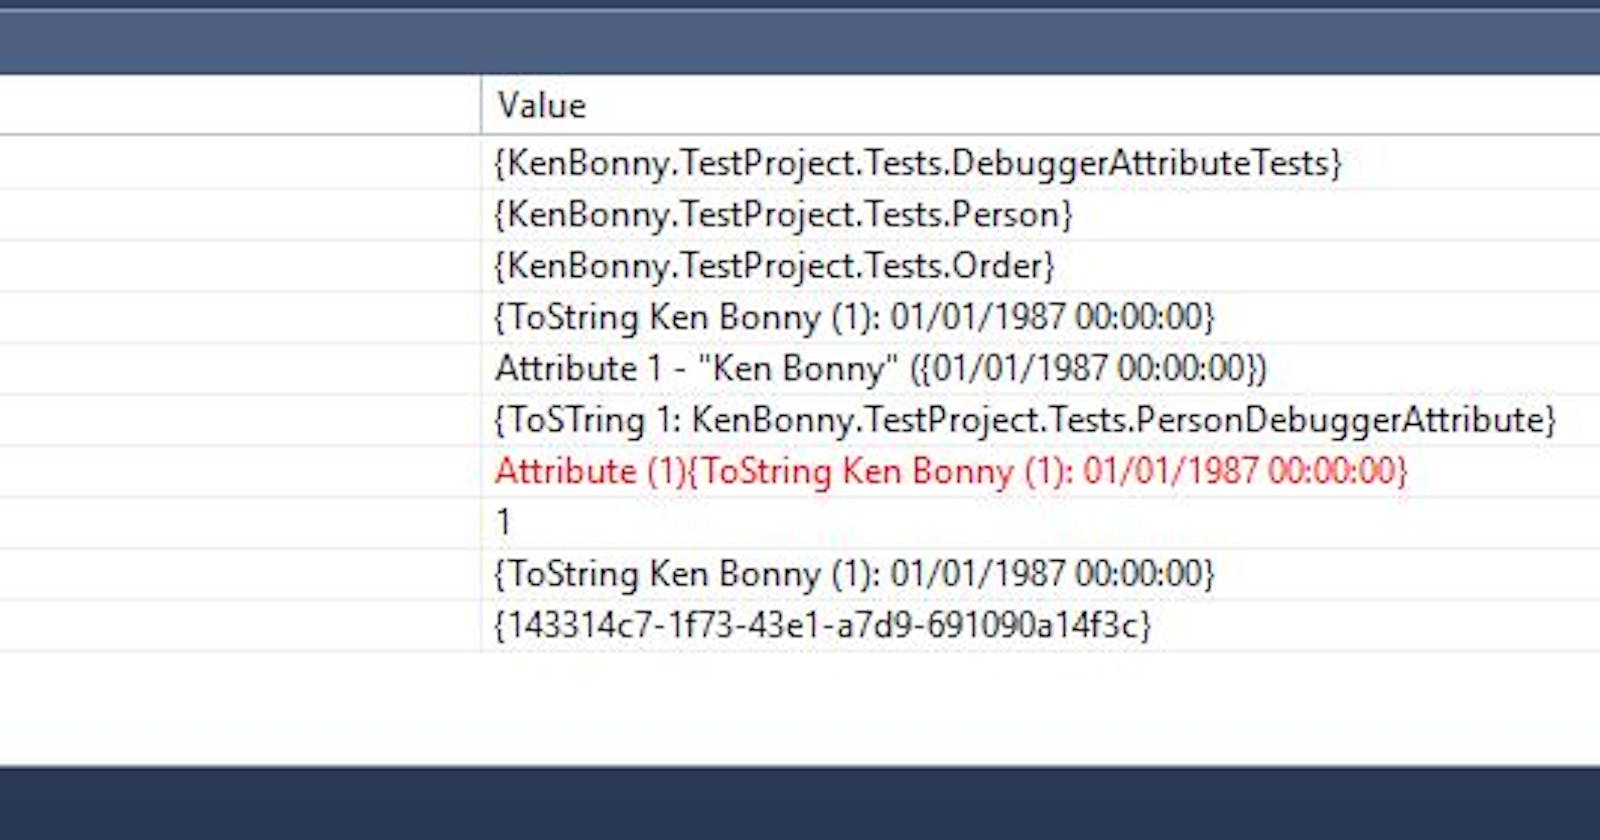
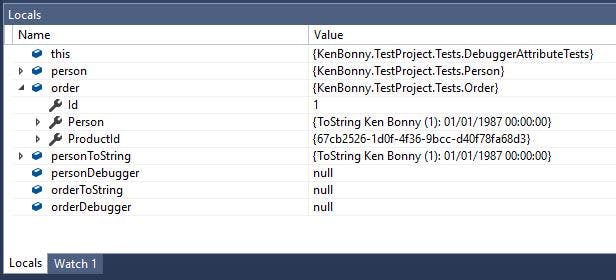
Without overriding the ToString method or applying the DebuggerDisplayAttribute on the Person class, the full class name (including namespace) is shown:
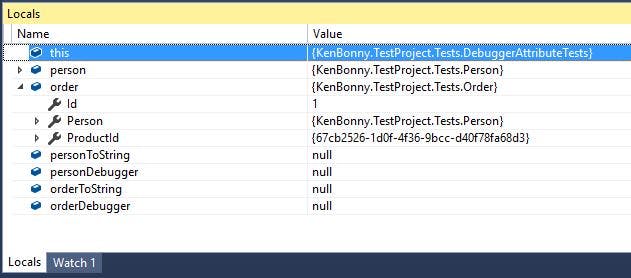
Both the person and order variables display full class names everywhere.
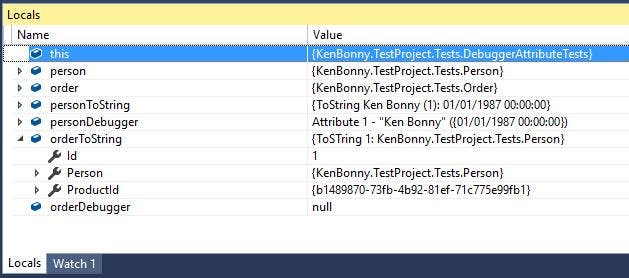
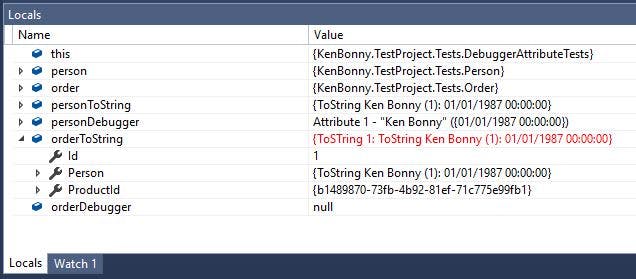
When the orderToString variable overrides the ToString method, the full class name is displayed as the Person property value. Notice that here are {} around the text. I think this is because the debugger adds those brackets around the class name and still does it when overriding the ToString.
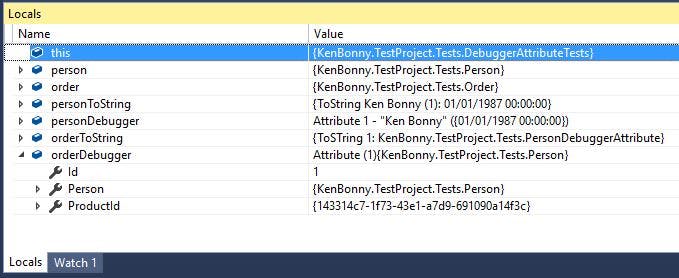
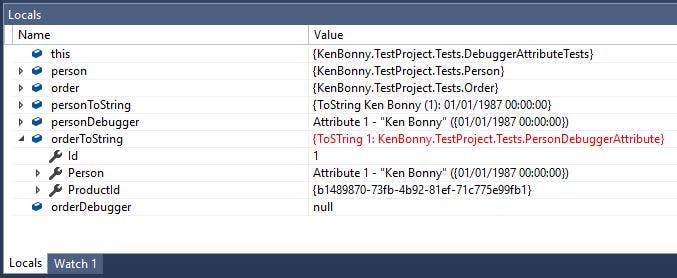
The DebuggerDisplayAttribute adds the full class name where the Person property is used on the orderDebugger variable.
Let's take a look at what happens in each scenario, when I overload the ToString method on the Person class.
Here we can see that the personToString variable displays the text from the ToString method. It still adds {brackets} around the text. I think the debugger uses the the ToString to display some information about the class and places those brackets to make it stand out. Now that I override the ToString, the method just returns another text.

When I put the personToString variable in the Person property of the orderToString and orderDebugger variables, I can see that the value is updated because it finds a new value for the instance and subsequently colours the text red to indicate that something changed. The value of the Person property also changes, but does not colour red. Not sure why.
Now it's time for the DebuggerDisplayAttribute to shine:
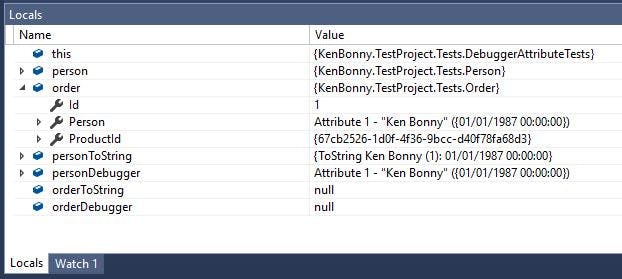
The personDebugger instance and Person property of the order instance shows that the attribute nicely displays the information that is requested.
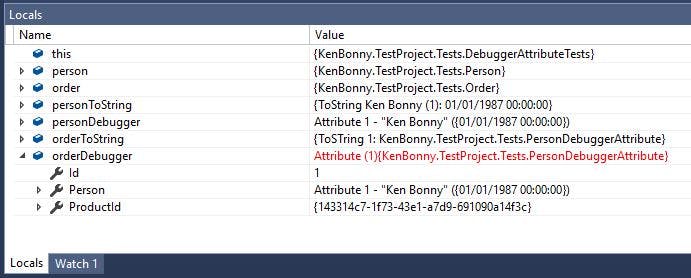
This is where it gets interesting: when the Person property is used in another DebuggerDisplayAttribute, then the attribute of the Person property is ignored in Visual studio and it seems the ToString method is called.
When I overload the ToString in the Order class, I can understand that. The ToString method does not know about the DebuggerDisplayAttribute, but I expect the IDE to know that the DebuggerDisplayAttribute would check for this attribute on child properties.
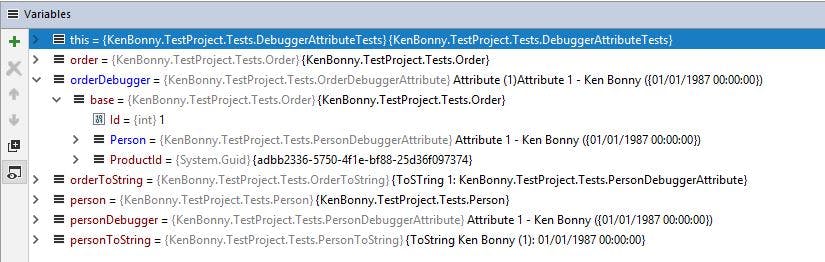
It gets even more interesting when I compare this to the Rider IDE, where it does display the correct way. In every other situation, it displays the same text as Visual Studio.
As a last option, I tried adding formatting info. It works in the ToString implementation, but not with the DebuggerDisplayAttribute. I think the DebuggerDisplayAttribute tries to get text to display, but it fails because it can't handle the date formatting and falls back to the ToString method.
internal class PersonToString : Person
{
  public override string ToString()
  {
    // displays: ToString Ken Bonny (1): 01 Jan 87
    return $"ToString {Name} ({Id}): {Birthday:dd MMM yy}";
  }
}

// displays the full class name of the class
[DebuggerDisplay("Attribute {Id} - {Name} ({Birthday:dd MMM yy})")]
internal class PersonDebuggerAttribute : Person { }
If I want more or different information during debugging than I supply through the ToString method, then the DebuggerDisplayAttribute can help.
All the code can be found in this gist.